
 I wrote here about the deceptive way the county presented information to the Florida Department of Environmental Protection (FDEP). That’s not the only item of interest in the report. FDEP also touched on affordability in a tangential way. The U.S. Environmental Protection Agency (EPA) has an affordability formula, which I adapted to use in my response to FDEP’s report. Links to those two documents are provided below:
FDEP Report: Keys Wastewater Report_Revised Final Draft_10 10 13
My response: FDEP_Report_KLWTD(2)
Here’s Table 21-3 from my report where I addressed affordability.
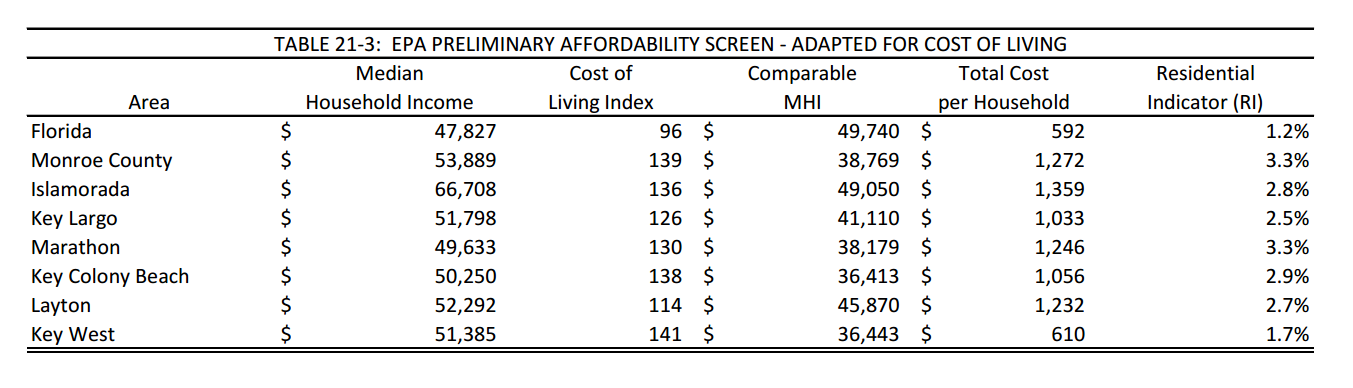
I didn’t break out any of the other unincorporated areas besides Key Largo. For one thing, Census Bureau data doesn’t break neatly over project boundaries. For another, some of the areas in the Lower Keys have such high median incomes and comparatively low contributions I’d have been arguing against myself. Here’s what this table would look like if I compared the unincorporated areas.
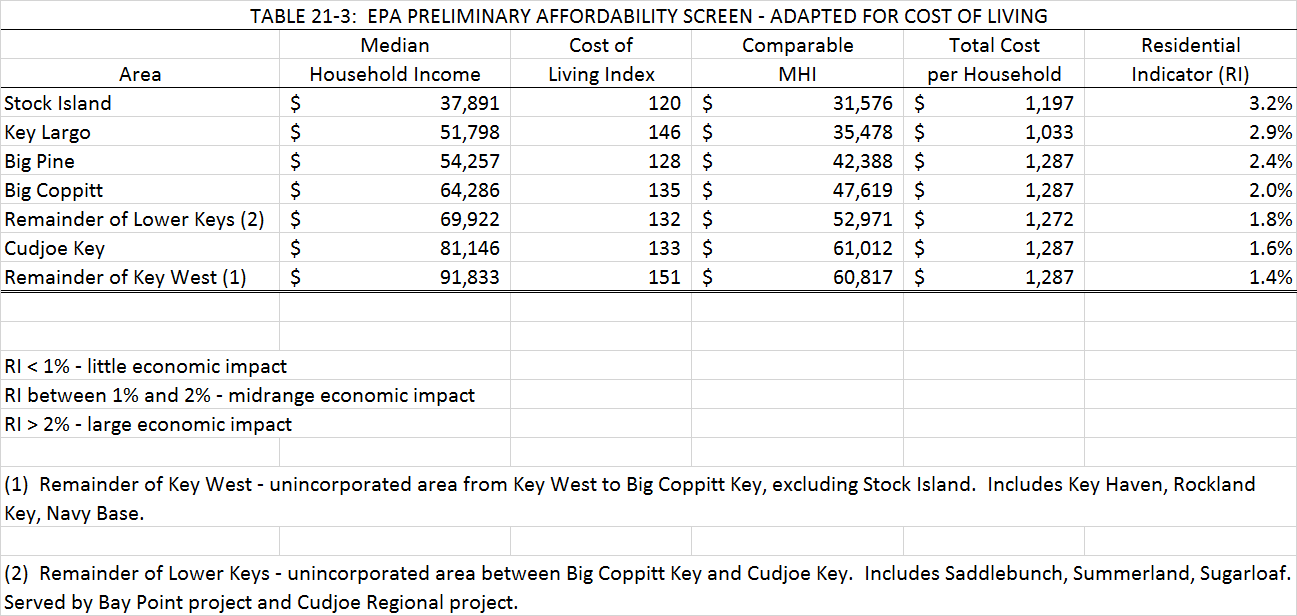
I removed the incorporated areas and I sorted from the largest Residential Indicator to smallest. The Residential Indicator (RI) is a measure of affordability. Typically, differences in the cost of living between areas are not taken into account. But since the cost of living in the Keys is so high, I really don’t think you can get at the truth about affordability without taking that into account.
At the bottom of the table are a few notes. Most important is what the RI means. An RI of less than 1% generally means a low economic impact. An RI between 1% and 2% indicates a moderate economic impact. And an RI over 2% means a high economic impact. Stock Island has the highest RI at 3.2%. Monroe County did try to address this. Stock Island residents pay the lowest assessment of all the areas examined, $2,700 per EDU. Even so, the Median Household Income (MHI) there is very low, which makes the RI quite high. You’ll notice that Key Largo has the second highest RI at 2.9%. We all know the story there. The only other area with a high economic impact would be Big Pine with an RI of 2.4%. The others, with their high MHI and generous treatment by Monroe County are within the moderate economic impact range.
Just so you know, “Free Range Voter” Bob Dean lives in Key Haven which has the lowest RI of all, 1.4%.
As always, please feel free to check up on me and/or do your own research. I got the MHI data from the Census Bureau’s American Fact Finder tool. I went with the 2010 numbers under the assumption that those would be the most accurate. I got the cost of living (COL) information from Sperling’s Best Places. When you see rankings of cities on various criteria, Sperling’s is often the information source. I couldn’t find where they keep historical data so I used current numbers. There was no COL for the two “remainder” areas so I mapped the Census data to figure out which areas were included in the Census Bureau’s numbers. I took an average COL from the two adjoining areas.
